China was the first major economy into the current pandemic and will be the only G20 economy to show positive growth this year.
The OECD has just revised up its view on Chinese economic growth for 2020 to just under 2%. Their previous forecast in June was for the Chinese economy to decline by 3.7% this year.
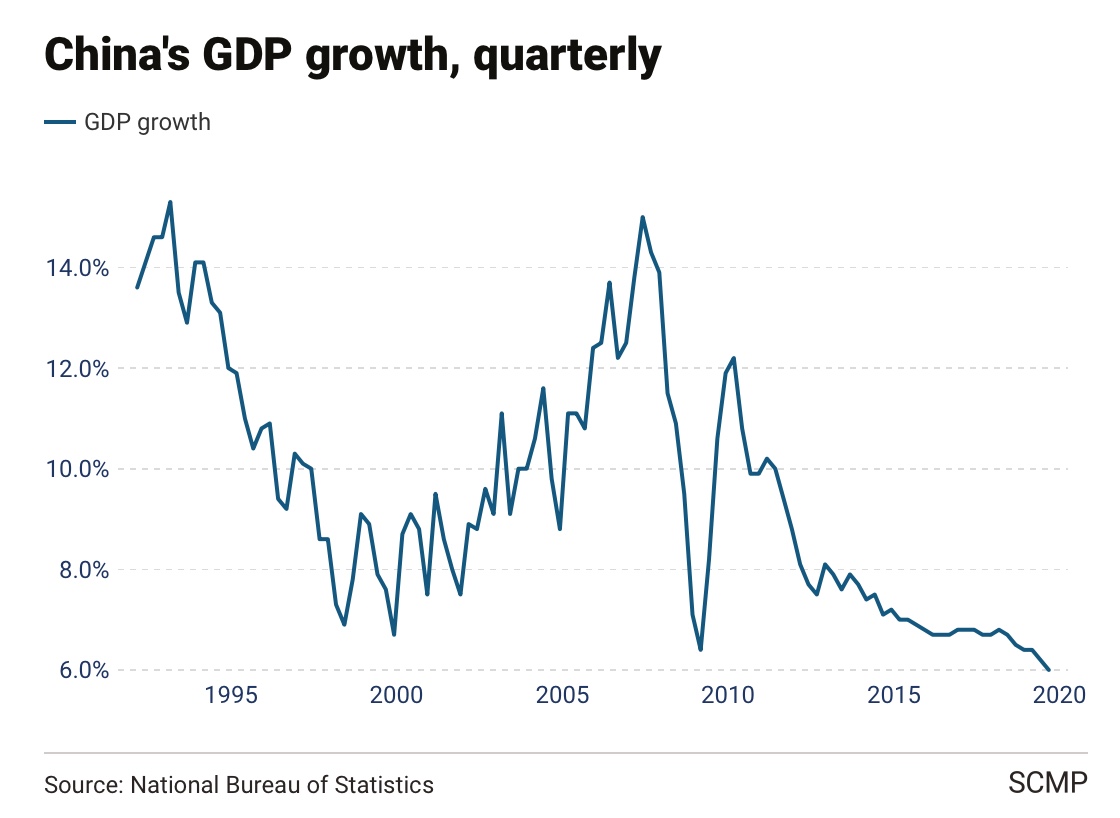
Now, 2% growth is far short of what we have come to expect from China in recent years, when numbers of 6% and 7% were more commonplace. But in a year when the global economy will slump by 4.5% as result of Covid 19, any positive economic outcome is a stand-out. Consensus economic forecasts for China‘s growth this year are in line with the OECD projection at around the 2% mark. There is also common ground around a 2021 forecast of 8% surge in the Chinese economy.
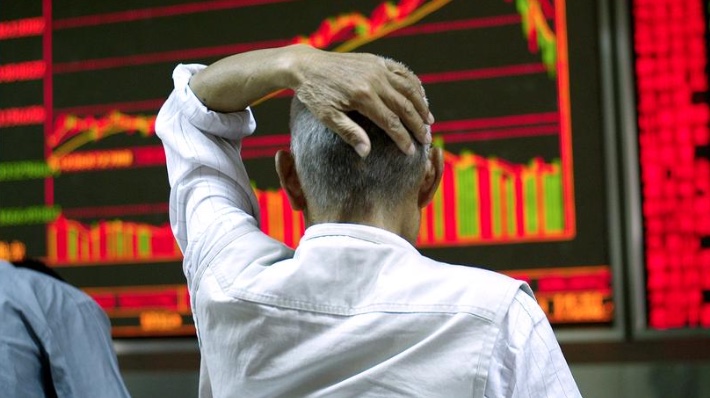
What got us to here?
It was January 23rd when Chinese authorities initiated a lock-down in Wuhan in a bid to combat the virus. Policy measures were severe. As measured by the Oxford University Stringency index, policy restrictions quickly moved to levels never seen in any other major country or region. However we began to see some easing from the end of March. The government prioritised factory opening where it was easier to maintain safety protocols. This relaxation was consistent through the summer, and increasingly was applied more widely in the economy. Today policy in China today has largely normalised.
In the past week we have seen retail sales and manufacturing numbers that are now positive on a year on year basis for the first time since the outbreak of the virus.
While analysts have often been sceptical on Chinese macroeconomic data, other higher frequency, on the ground ,data also supports this improved economic picture. Restaurant and take-away activity are close to pre-outbreak activity levels. Daily sub-way ridership is just 10% below 2019 levels. City traffic congestion continues to rise. Property sales in the 30 major cities are above 2019 levels.
In July and August imports of steel and aluminium rose dramatically to meet the higher demand from manufacturing and construction.
We have also seen a jump in Chinese exports in recent months, but this is very much related to the global pandemic and the surge in global demand for PPE (plastics, textiles, fabrics) which China can supply. In recent months exports have been up by over 3% compared to last year. Without the PPE demand, export growth would have been negative – reflecting the global slump.
There is further opening to go. In recent weeks, for example, the government has relaxed capacity limits in cinemas and on domestic flights.
If one of the characteristics of the Chinese response was severe and speedy lock-down, swift government economic support was also key. From early March, we saw a series of initiatives such as subsidised loans to farmers, deferring loan repayments for SMEs, reducing tariffs on critical imports and reducing social taxes for employers. SMEs account for about 80% of jobs in China.
Reserve requirements for banks were also lowered and interest rates nudged lower.
China has also been active in the realm of vaccine development. While none of its three potential drugs have cleared Phase 3 trials, the government has given the go-ahead for them to be used on an emergency basis. One is already being used by the Chinese military. The UAE has also given the go-ahead for a Chinese vaccine to be used on an emergency basis making it the first country outside of China to so do.
Analysts estimate that the economic impact on China of a successful vaccine by mid 2021 would be to add just 0.5% to growth in that year. This is less than the likely impact of a vaccine on other major economies. The growth impact of a successful vaccine would be more substantial in the US and Europe, where the pandemic is relatively less well contained. It could add 2% to European GDP and over 3% to the US economy in 2021.
According to the John Hopkins data, China continues to report a small number of cases but these are classified as “imported” – a vast improvement on levels in February and March. Coupled with an economy which, according to this OECD forecast, will be back to normal growth levels in 2021, this has to be seen as a solid result.


 Investors need to find a balance between short term and long term factors in making decisions.